
What you see are pieces of steel. To most people they look just alike. Yet one will flex when gently pushed; another will retain a sharp edge for years on end. Until you use some force to find out, you can’t tell them apart.
What’s inside, the way atoms is set up, if you will (tells the story). And hardness, as it turns out, is nothing more than resistance to indenting. It means the difference between breaking part and keeping them intact.
How to Measure Steel Hardness
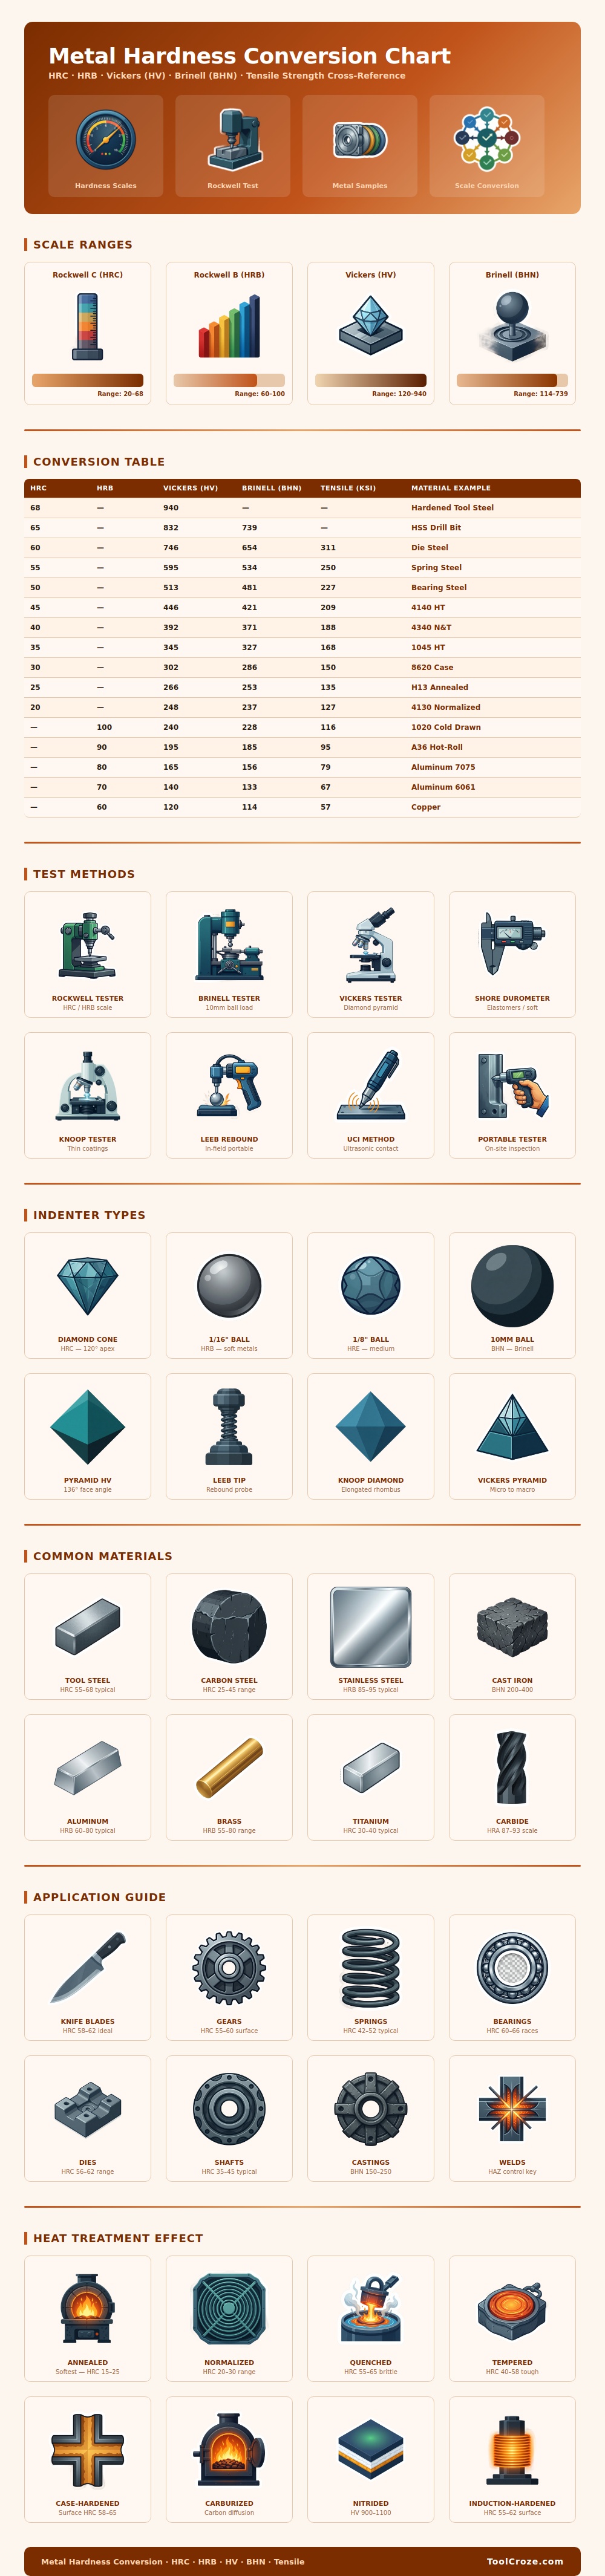
You can see in the chart where one measurement scale overlap another. Hardened steel is usually measured using Rockwell C due to its simplicity and speed. Simply push a diamond cone into the piece, turn the dial and go. Mild steel or aluminum though needs something else. Pushing that same diamond cone around will either destroy surface or plunge too far. In those cases they use a little steel ball on the B scale. It spreads out the force so you get a clear reading without tearing up the part. Knowing which test apply to your material is key to getting correct readings. But not all are back-up methods; each has a particular use.
Vickers uses a triangular shaped diamond pyramid that leaves a square indent. This is good if you want precise measurements in thin material or on a case hardened surface.
Brinell pushes a big old steel ball through your metal to give an average of the hardness over a bigger area. That’s important, since metals aren’t usually uniformly hard. Cast iron, for instance, has little specks of graphite flakes mixed in it. An indenter can land on one of those flakey spots or find itself on a grain of something harder throwing off results. Brinell averages out all that variance, giving you a real world average of how hard the thing really is.
Another useful shortcut provided by the chart is a link between tensile strength and hardness. So you could guesstimate how much pull a bar will stand up to, based off the hardness of the metal. For instance, a 55 HRC spring steel rod would have about 250 ksi of tensile strength. While that’s a good general guide for steels, don’t try to extrapolate to any treated surface or other metal; it just isn’t going to work. Think of it more like a sanity check when reading specs, instead of some kind of holy law.
Steel’s properties change with heat treatments. Softening the steel via annealing leaves it ductile and easy to machine prior to hardening. Hardening (quenching) trap the carbon atoms in place to form a very hard but also brittle substance called martensite. Stopping at this stage may leave your gears snapping apart under shock load. Tempering releases internal stresses while sacrificing some hardness for toughness. This chart illustrates how H13 die steel behaves as it swings back-and-forth between tempered and annealed stages. You’re tweaking the compromise between structural integrity versus wear resistance.
The problem arises where folks get hung up on the numbers instead of how the number apply. 68 HRC is great for holding a knife edge, but if you drop it on concrete, you’ll probably chip your blade. You want a bearing race that is hard enough so it won’t wear out from the load it carries. But you also need that race to be on a shaft that has some flex to accommodate slight misalignments. Too hard all around and none of them can move and they’ll all snap apart. It’s not about making everything as hard as possible but rather making things appropriately hard based upon their specific stress pattern.
Portable rebound testers are also used as one of these test methods and can be found in their visual guide. For example, if you have field welds or a large casting that you can’t remove to the lab bench, this is a good way to go. The tester measures how much energy a ball loses upon bouncing from the surface. While not quite as accurate as a laboratory press, it will let you know whether or not your heat treatment was on-target. You don’t need perfect accuracy on each check; you simply want to know if it’s in-range.
So hardness is a combination of materials science and everyday experience. Those numbers on that scale? They’re guidelines. What you need to know: can I predict how my steel will perform in terms of impact, friction, and fatigue? The chart above is good to have close by. But trust your understanding of what those numbers mean for where they fall along the durability spectrum. Toughness keeps the job alive, while hardness protects the part. Consider this trade-off each time you choose a grade of metal or heat treatment.
It should of been more obvious. One should of checked the moddern steel properties first. You would of seen it sooner if you look at the chart. Making sure the results is correct is naturaly important for any engineer. To be honest, finding the actualy right hardness can be a bit of a luxurius task when you are in a hurry. Don’t let mistakes dissapears into your reports.