⚙️ Transmission Gear Ratio Calculator
Calculate gear ratios, output RPM, torque multiplication, and vehicle speed for any transmission setup
Forward Gears
Drivetrain & Engine
| Transmission Type | 1st Gear | 2nd Gear | 3rd Gear | 4th Gear | 5th/Top | Reverse |
|---|---|---|---|---|---|---|
| 5-Speed Manual (Car) | 3.50 | 2.05 | 1.36 | 1.00 | 0.78 | 3.27 |
| 6-Speed Manual (Sport) | 3.82 | 2.15 | 1.48 | 1.10 | 0.86 | 3.50 |
| 6-Speed Automatic | 4.17 | 2.34 | 1.52 | 1.14 | 0.75 | 3.40 |
| 8-Speed Automatic | 4.71 | 3.14 | 2.10 | 1.67 | 0.67 | 3.30 |
| 4-Speed Truck Manual | 4.03 | 2.33 | 1.45 | 1.00 | N/A | 4.03 |
| 6-Speed Truck Manual | 5.99 | 3.93 | 2.64 | 1.72 | 1.00 | 5.64 |
| Motorcycle 6-Speed | 2.46 | 1.77 | 1.35 | 1.07 | 0.89 | N/A |
| Race Sequential 6-Spd | 3.08 | 2.19 | 1.71 | 1.40 | 1.17 | N/A |
| Axle Ratio | Application | Characteristic | Fuel Economy | Towing Ability |
|---|---|---|---|---|
| 2.73:1 | Economy Cars | Overdrive biased | Excellent | Poor |
| 3.08:1 | Muscle / Sport | Balanced OD | Very Good | Fair |
| 3.27:1 | Passenger Cars | Balanced | Good | Fair |
| 3.42:1 | Trucks / SUVs | Mild tow bias | Good | Good |
| 3.55:1 | Trucks | Tow optimized | Fair | Good |
| 3.73:1 | Trucks / 4WD | Towing rated | Fair | Very Good |
| 4.10:1 | Off-Road / HD | Crawl optimized | Poor | Excellent |
| 4.56:1 | Heavy Duty Truck | Max tow/torque | Poor | Excellent |
| Gear | Gear Ratio | Overall Ratio | Speed (mph) | Speed (km/h) | Wheel Torque (200 lb-ft engine) |
|---|---|---|---|---|---|
| 1st | 3.50:1 | 13.06:1 | 9.5 | 15.3 | 2,612 lb-ft |
| 2nd | 2.05:1 | 7.65:1 | 16.3 | 26.2 | 1,530 lb-ft |
| 3rd | 1.36:1 | 5.07:1 | 24.5 | 39.5 | 1,015 lb-ft |
| 4th | 1.00:1 | 3.73:1 | 33.4 | 53.7 | 746 lb-ft |
| 5th | 0.78:1 | 2.91:1 | 42.7 | 68.8 | 582 lb-ft |
The relation of the drive gears simply shows how quickly the input shaft rotation happens compared to the output shaft rotation. Think about it like this: the engine must do some turns for one single rotation of the output. The Transmission works like a lever system, in higher Gear ratio, it pushes bigger force down to the wheels.
Here is a simpler way to describe that. Picture two circles side by side where one has half the width of the other. The little circle needs to twist twice to cover the same distance as the big.
How Gear Ratios Work in a Car
Here is where the 2:1 ratio comes from. The gears work by the same principle through their teeth. The math is easy: you divide the number of teeth of the driven Gear by that of the driving Gear.
When the driven has 10 teeth and the driving 20, you get a 2:1 ratio.
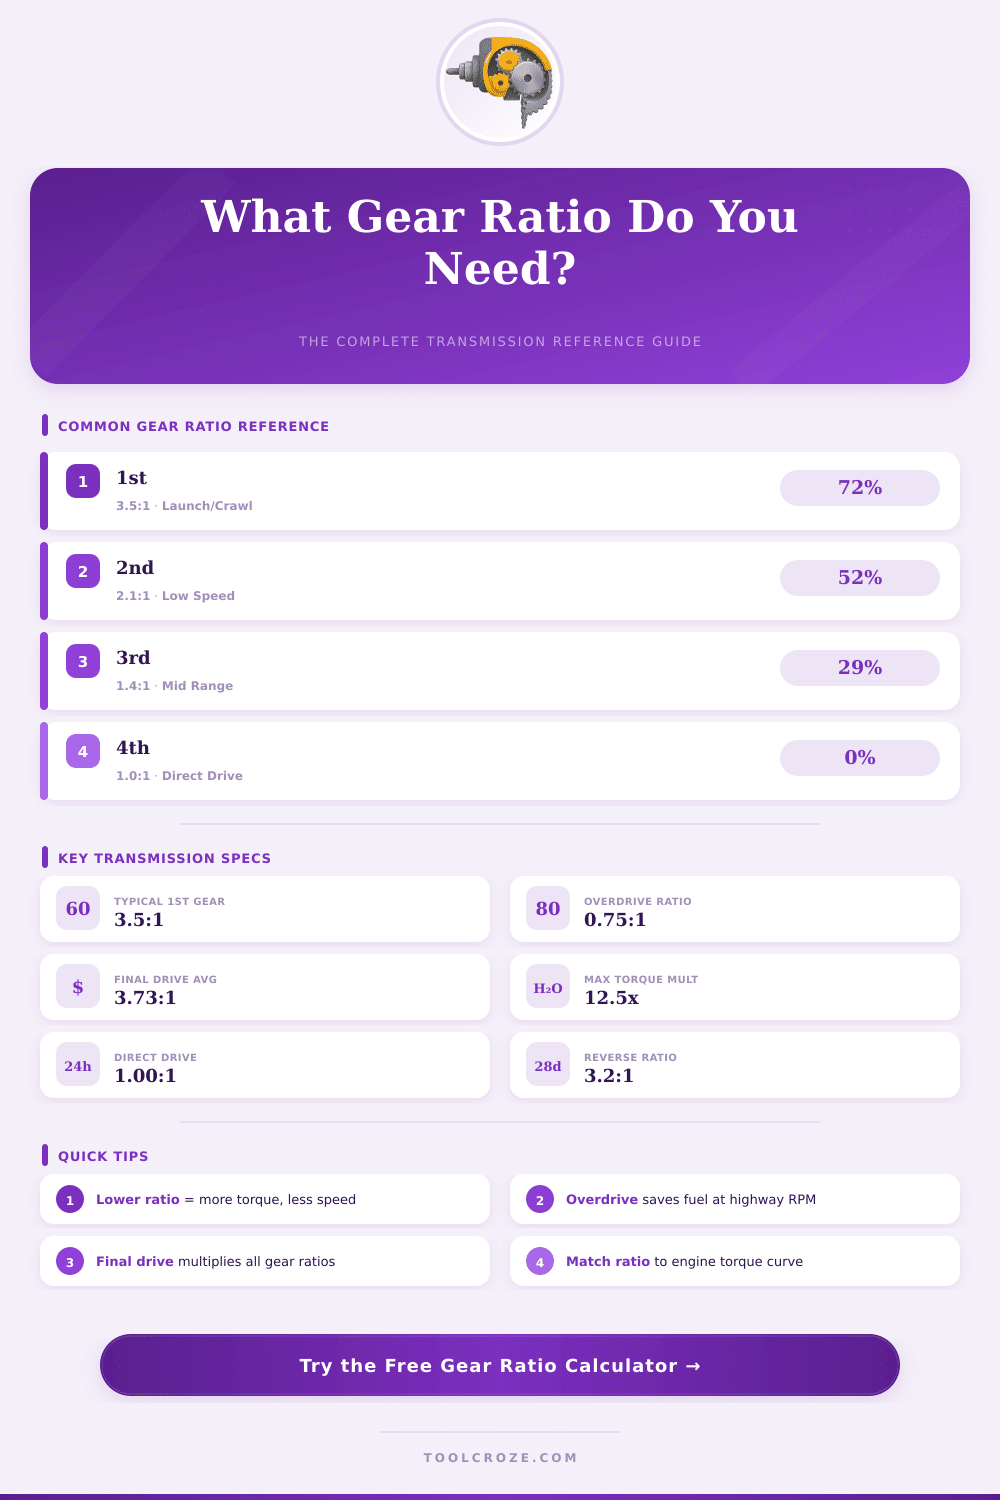
In the Transmission, every Gear is made up of a pair of gears that mesh one with the other. The first Gear usually has quite a heavy ratio, around 3.5:1 in most cases. That means that the engine twists around 3.5 times for one rotation of the output shaft.
The beauty of that is that you get force to start from a stop. The top Gear, on the otehr hand? It commonly is like 0.7:1, where the output shaft twists more quickly than the engine output.
In almost every four-speed Transmission, the third Gear stands in what you call direct drive, so 1:1. One turn in, one out. Many older three- and four-speed manuals, along with some early automatics, also depended on that 1:1 ratio for the highest Gear.
Speed and force flow passes without multiply or reduce.
Heavy ratio has big numbers, for instance 4.11 or 3.9, and it gives grate straight boost. The downside? The engine screams at highway speeds.
Light ratio uses small numbers like 3.08 or 2.9. It helps fuel economy during highway travel, but starting from a stop feels a bit hopeless. There is always that conflict between both.
For a road car, the ideal is a ratio as light as possible for highway efficiency, but enough drive gears to keep the boost alive.
Even so, the drive ratio tells only half the story. The differential near the steering wheels has its own ratio, that works together with it. The engine force first gets multiplied through the Transmission, then again through the differential.
The whole picture comes from RPM multiplied by the tire width, then divided by the final drive ratio and the Gear ratio, with 336 included, which gives the real speedrelation that hits the street. Bigger drive ratios expand the delivered force and the skill to handle load during boost, which eases starts and keeps the stall flat under weight. In the box itself, the ratios can stack together for strong boost in low gears, then spread more broadly in the high to reach bigger top speeds.