⚙️ Final Drive Gear Ratio Calculator
Calculate ring & pinion ratios, wheel RPM, vehicle speed, and torque multiplication for any drivetrain
| Application | Ring Teeth | Pinion Teeth | Ratio | Best Use | Tire Size Range |
|---|---|---|---|---|---|
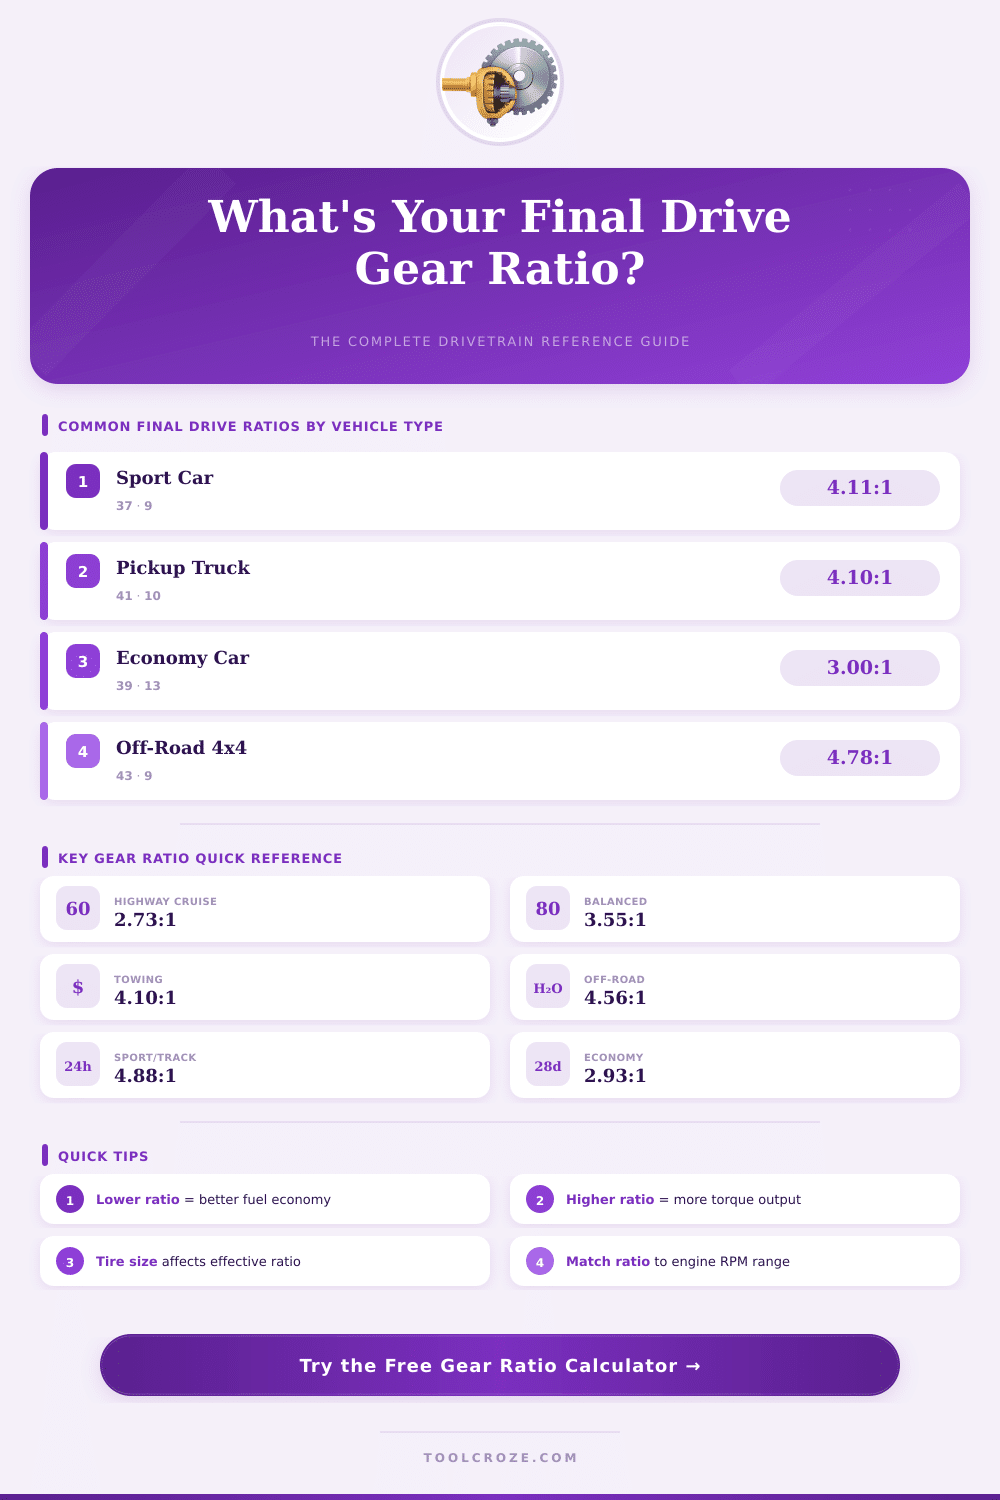
| Economy Sedan | 39 | 13 | 3.00:1 | Fuel economy | 14–16 in |
| Highway Cruiser | 41 | 15 | 2.73:1 | Long-haul low RPM | 15–17 in |
| Performance Street | 41 | 11 | 3.73:1 | Balanced sport | 17–19 in |
| Sport / Muscle | 37 | 9 | 4.11:1 | Acceleration | 17–20 in |
| Pickup Truck | 41 | 10 | 4.10:1 | Towing & hauling | 17–20 in |
| Heavy Tow | 43 | 10 | 4.30:1 | Max tow capacity | 18–22 in |
| Off-Road Mild | 41 | 9 | 4.56:1 | Light off-road | 33–35 in |
| Off-Road Extreme | 43 | 9 | 4.78:1 | Rock crawling | 35–40 in |
| Rock Crawler | 46 | 9 | 5.13:1 | Extreme crawl | 37–44 in |
| Track / Formula | 44 | 9 | 4.88:1 | Max acceleration | 17–18 in |
| Stock Tire Dia. | New Tire Dia. | Installed Ratio | Effective Ratio | Correction Needed |
|---|---|---|---|---|
| 28 in (711mm) | 28 in (711mm) | 3.73:1 | 3.73:1 | None |
| 28 in (711mm) | 30 in (762mm) | 3.73:1 | 3.48:1 | Go to 4.10 |
| 28 in (711mm) | 33 in (838mm) | 3.73:1 | 3.17:1 | Go to 4.10–4.56 |
| 28 in (711mm) | 35 in (889mm) | 3.73:1 | 2.99:1 | Go to 4.30–4.56 |
| 28 in (711mm) | 37 in (940mm) | 4.10:1 | 3.10:1 | Go to 4.88–5.13 |
| 28 in (711mm) | 40 in (1016mm) | 4.56:1 | 3.19:1 | Go to 5.13+ |
| Gear Ratio | @ 2000 RPM | @ 3000 RPM | @ 4000 RPM | @ 5000 RPM | Tire Dia. (28 in) |
|---|---|---|---|---|---|
| 2.73:1 | 61.5 mph | 92.2 mph | 123 mph | 154 mph | 28 in / 1:1 trans |
| 3.00:1 | 55.9 mph | 83.9 mph | 112 mph | 140 mph | 28 in / 1:1 trans |
| 3.55:1 | 47.3 mph | 71.0 mph | 94.6 mph | 118 mph | 28 in / 1:1 trans |
| 3.73:1 | 45.0 mph | 67.6 mph | 90.1 mph | 113 mph | 28 in / 1:1 trans |
| 4.10:1 | 40.9 mph | 61.4 mph | 81.9 mph | 102 mph | 28 in / 1:1 trans |
| 4.56:1 | 36.8 mph | 55.2 mph | 73.7 mph | 92.1 mph | 28 in / 1:1 trans |
| 4.88:1 | 34.4 mph | 51.6 mph | 68.8 mph | 85.9 mph | 28 in / 1:1 trans |
| 5.13:1 | 32.7 mph | 49.1 mph | 65.5 mph | 81.9 mph | 28 in / 1:1 trans |
The final drive gear report forms the finish of the gear change between the engine and the moving wheels. It sits in the differential or in the gearbox, based on the kind of engine and the setup of the drivetrain. Changing it, one can greatly change the behavior of the car in many situations.
What exactly is this report? One counts it by sharing the amount of teeth in the ring gear by the amount of teeth in the pinion gear. It works like any other gear report; basically it is a multiplier of the torque.
Final Drive Gear Ratio: What It Is and How It Affects a Car
In bigger report, the torque grows. For instance, if the final drive report is 4.11, the axle shaft twists 4.11 times for every one turn of the final wheels. If it is 3.23 the axle shaft must turn only 3.23 times for one turn of the wheel.
In road cars, the usual final drive gear report ranges between 3:1 and 4.5:1. That means that the ring gear twists three to four and half times more slowly than the pinion gear. That setup is built for keeping both the performance and the contlor under check.
Here comes the funny part. Report higher, like 3.73, provide shorter gearing with more torque, which helps with better speed. Report lower, like 3.23, give longer gearing with less torque, but better chance for high top speed.
Think about it like this, sporty car starts quickly and can have good time from 0 to 100, but its top ends at lower speed. Touring car reaches big upper speed, but needs more time to get their.
The whole final drive gear report includes the gearing of the gearbox, the gearing of the transfer case and the gearing of the axle. The final drive gear is normally tied to the differential, and all other gears in the case carry the energy through it to move the wheels. Old strong cars commonly used reports like 3.90 or 4.10 for mighty speed.
Engines with turbo or high revolutions, when with close gears in the case, commonly choose lower final drive gear, because their force comes more smoothly in the range of revolutions.
Changing the report in the differential, one changes the speed without breaking the match between the gears. Going from 3:1 to 4:1 in the final drive, one wins a bit of speed, but not full 33 percent because of losses in the turning. In cars with front wheel-drive, the change of the final drive is more tricky.
One must open the case up, and swap the ring gear and the matching pinion gear as pair, otherwise they grind and will be noisy.
The final drive gear reports usually are stamped on the body of the differential or found in the technical specs of the vehicle. Websites with data and forums about cars also list info about gear reports for certain makes and model. High final drive gear report boosts the speed and the pulling force, butreduces the use of fuel.